Current Audits - Chart
Current Audits - Chart is a dashboard element in the AuditBLOOM system that displays a pie chart with information about current audits. This chart shows the number of audits currently in progress and not yet completed. Users can quickly assess the status of audits and their distribution by status.
To the right of the chart, a breakdown of audit statuses is displayed with corresponding colors. For example:
- Dispute Ongoing (blue color)
- Started (green color)
Each user sees only the audits they have access to based on their access rights and assigned roles.
Using the Chart
The chart helps you quickly assess:
- The total number of current audits.
- The distribution of audits by status.
This allows the user to effectively plan their work and focus on priority audits.
Example of the Chart
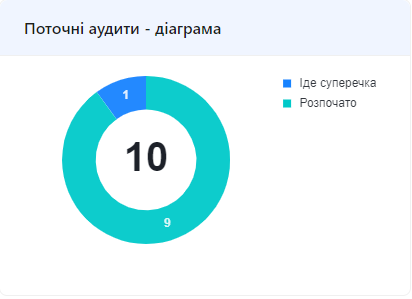
The chart shows the distribution of current audits by status.
Notes and Tips
-
Data Relevance: The chart displays real-time data, so you always see up-to-date information about current audits.
-
Accessibility: If you don't see some audits, make sure you have access to them according to your permissions.
Frequently Asked Questions (FAQ)
Question: Why do I see fewer audits than expected?
Answer: You only see audits that you have access to based on your rights and assigned roles. Contact the system administrator if you need access to other audits.