Violations by Objects - Daily Chart
Violations by Objects - Daily Chart is a report in the AuditBLOOM system that displays the number of identified violations over a selected period. This chart helps visualize violation dynamics on audit objects and analyze trends in their occurrence.
- Displays audits with "Closed" and "Archived" statuses.
- Displays only audits that the user has access to.
- Vertical Axis: Number of Violations
- Horizontal Axis: Days (Dates)
Using the "Detail by Audit Objects" option, you can customize the chart display:
- If the checkbox is unchecked, the chart shows summarized information about the total number of violations per day.
- If the checkbox is checked, the chart displays separate lines for each audit object where violations were identified during the selected period. Each line has its own color, allowing you to compare situations across different objects.
Filter Configuration
To refine the analysis, the following filters are available:
- Audit Template: Select the required audit template from the list.
- Audit Object: Choose audit objects to display data only for them.
- Auditor: Select auditors whose audits you want to include in the report.
- Overdue: Use this filter to display only overdue audits.
How to Use the "Violations by Objects - Daily Chart" Report
Roles:
- Violations by Objects - Daily Chart
Workspace Type:
- Full Workspace
Step 1: Go to the "Reports" Section
- Log in to AuditBLOOM with an account that has the necessary access rights.
- In the main menu, select the "Reports" section.
- Choose "Violations by Objects - Daily Chart" from the list of available reports.
Step 2: Set the Analysis Period
- Specify the start and end dates for the period you want to analyze.
Step 3: Configure Filters
- Audit Template: Select the required audit templates.
- Audit Object: Choose the necessary audit objects.
- Auditor: Select the auditors.
- Overdue: Check the box to include only overdue audits in the report.
Step 4: Select "Detail by Audit Objects" Option (if needed)
- Detail by Audit Objects: Check the box if you want to display separate lines for each audit object.
Step 5: Generate the Report
- Click the "Generate" button to display the data on the chart.
Example Chart
Below is an example of the violations by objects chart:
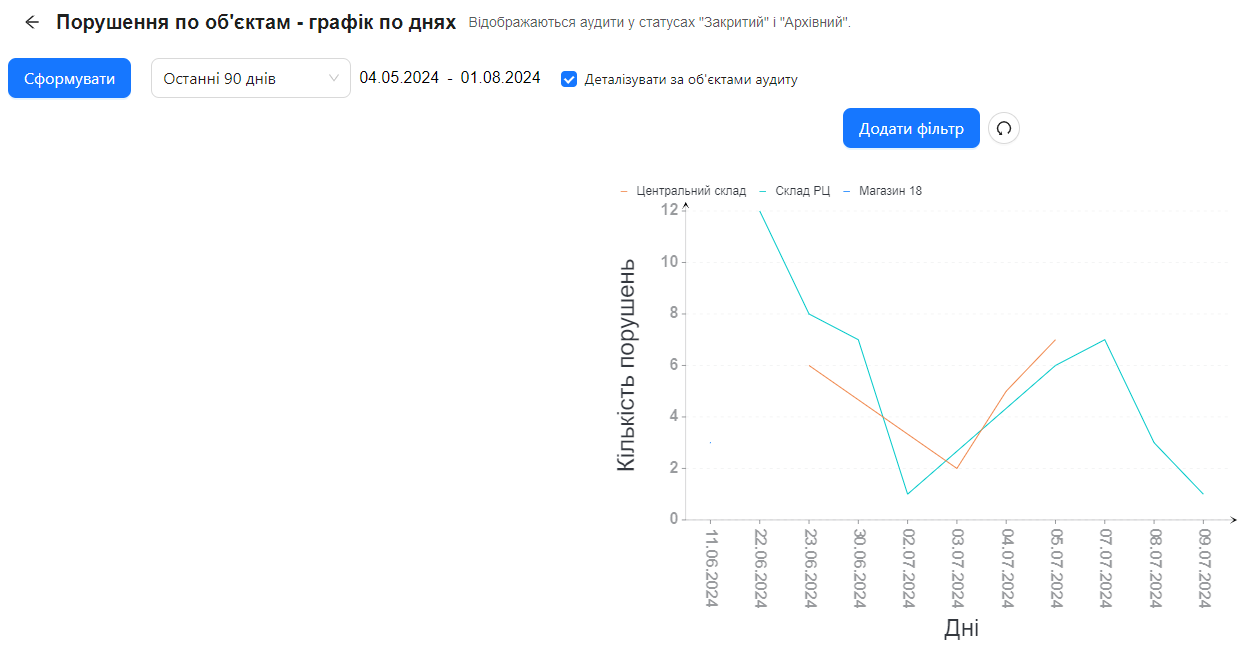
- The chart shows the number of identified violations for each day of the selected period.
Notes and Tips
-
Trend Analysis: Use the chart to identify periods with an increased number of violations, which may indicate problem areas or the need for additional control.
-
Object Comparison: The "Detail by Audit Objects" option helps compare the number of violations across different objects and identify those with the highest number of violations.
-
Regular Monitoring: Regular use of this chart helps monitor the condition of audit objects and respond promptly to an increase in violations.
Frequently Asked Questions (FAQ)
Question: Why are some violations not displayed on the chart?
Answer: Ensure that the filters and analysis period cover the necessary data. Also, remember that the chart displays audits only with "Closed" and "Archived" statuses. You may also lack access to some audits.
Question: Can I export the chart to a file?
Answer: Currently, chart export is not available.
Question: What does the "Overdue" option in the filters mean?
Answer: This filter allows displaying only violations identified in overdue audits (audits conducted with delays). Check the box if you want to include overdue audits.
Question: How can I see data for a specific audit object?
Answer: Use the "Audit Object" filter to select a specific object. You can also check the "Detail by Audit Objects" box to display data for all objects separately.
Question: Why does the chart appear empty after applying filters?
Answer: There may be no data for the selected filters and period. Try expanding the period or adjusting the filter settings.